Ecommerce Dashboard
Keep your eyes on the ball. Instantly see what's going on with your sales and get insights on where your business is headed.
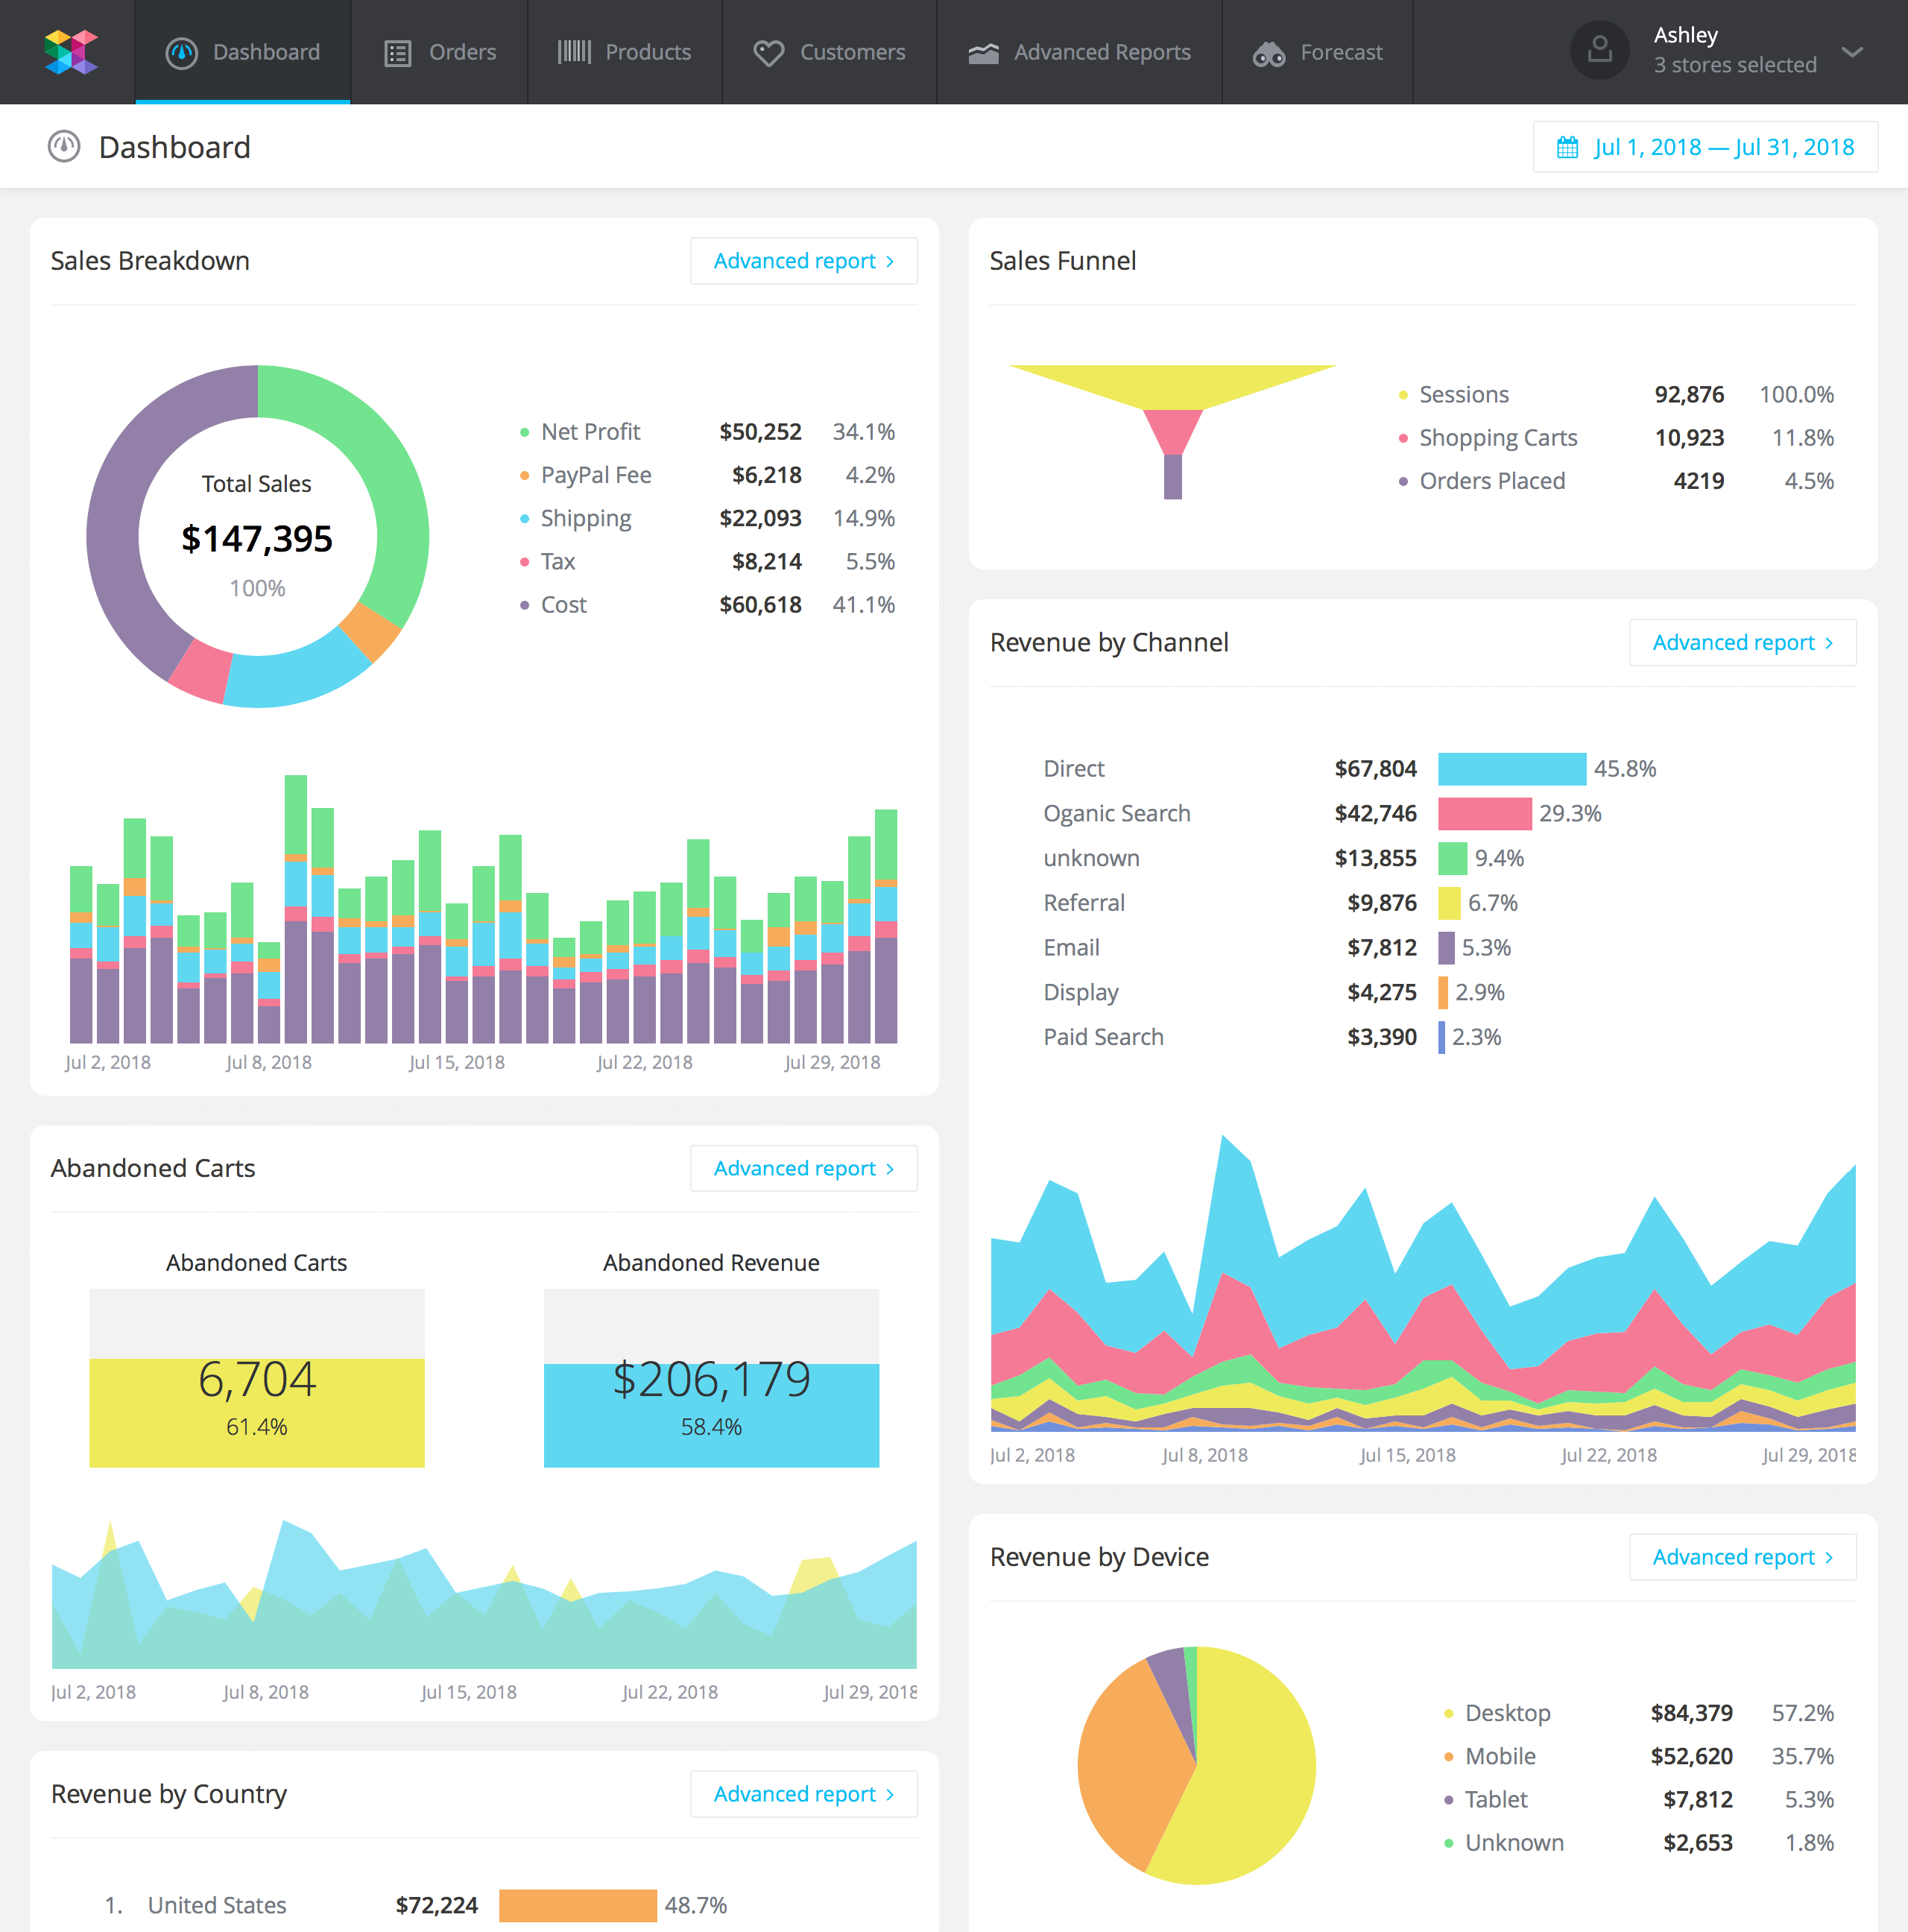
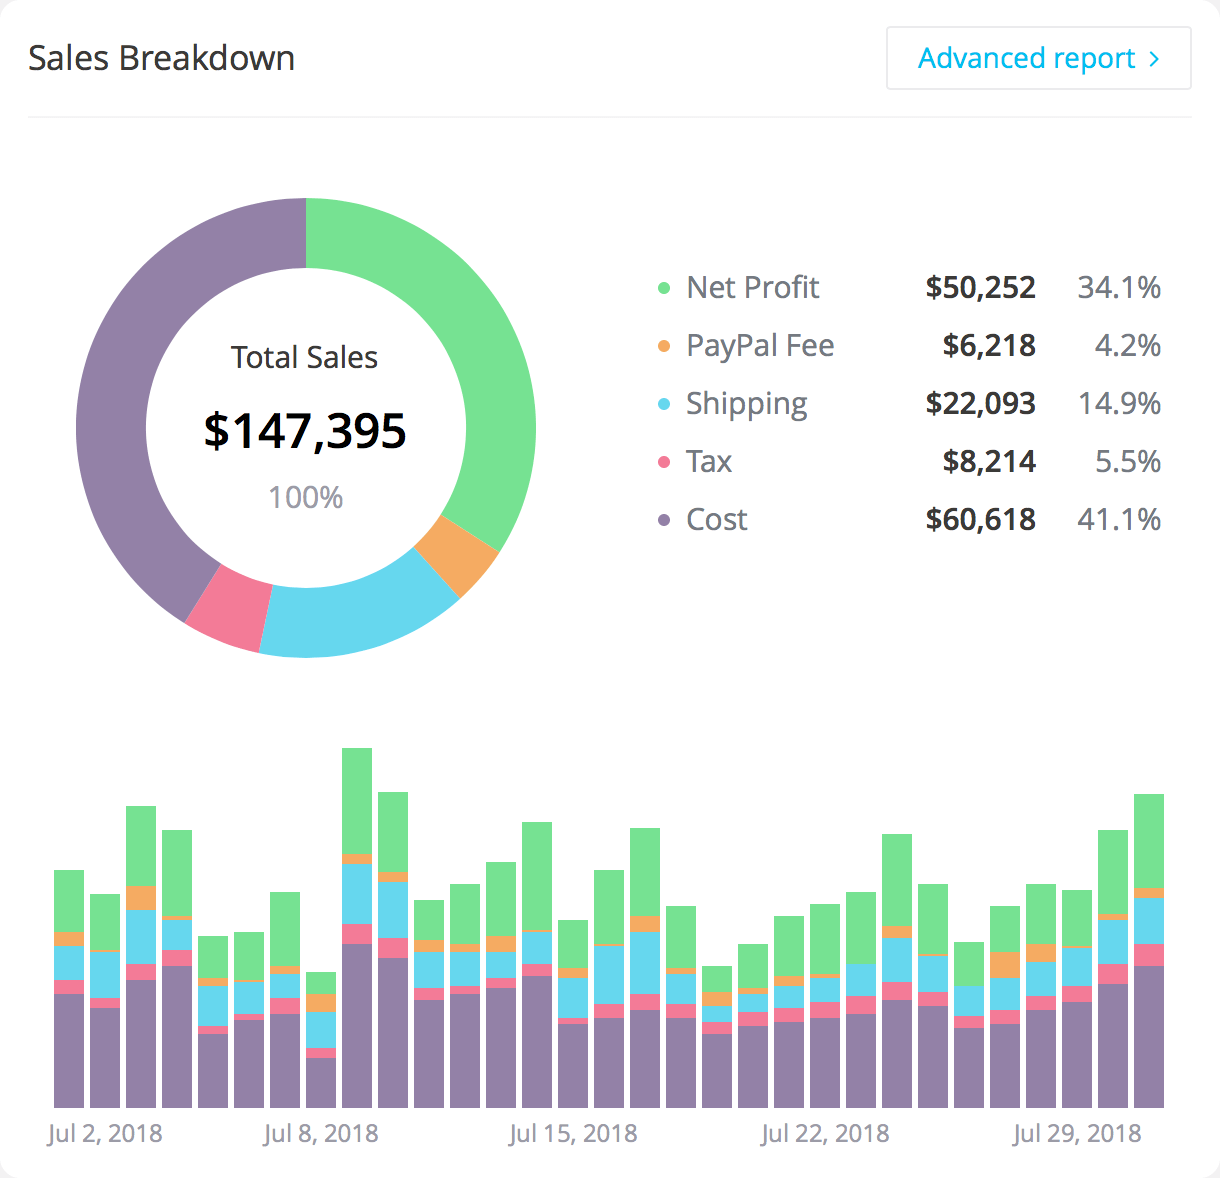
Sales breakdown
This widget on your ecommerce dashboard shows how your total sales break down into shipping, tax, transaction fees, product cost, and net profit. See it day-by-day and for the whole period.
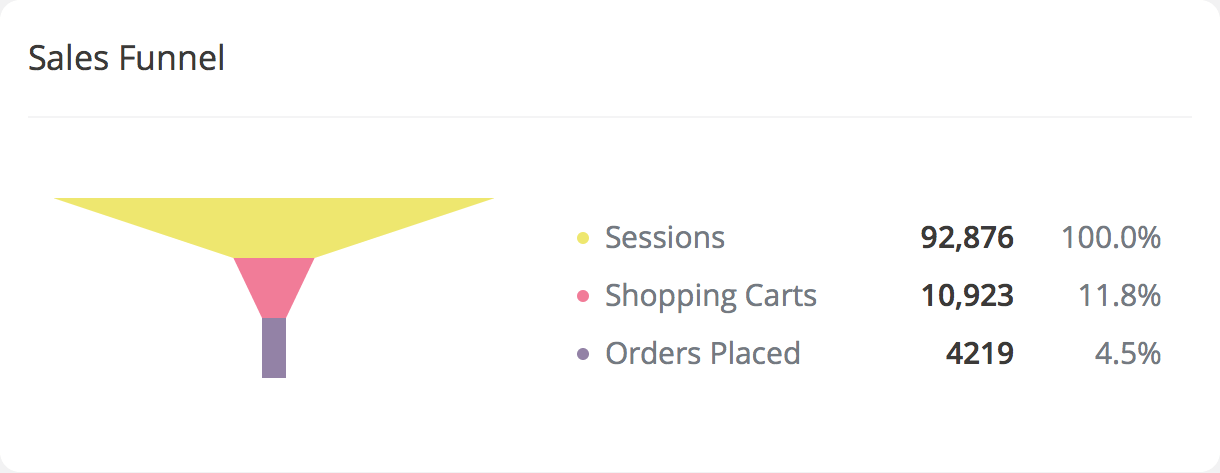
Sales funnel
See how well your visitors are converting into customers as they travel through your sales funnel.
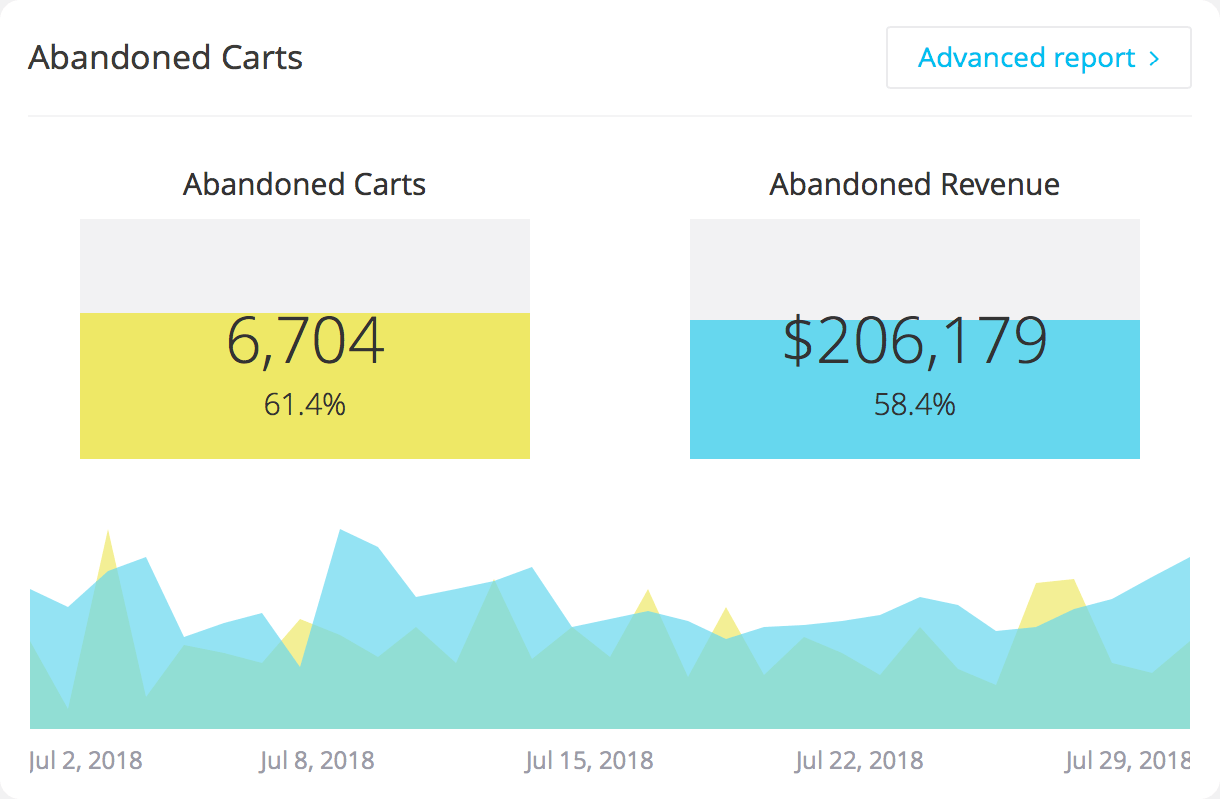
Abandoned carts
Be able to notice a spike in cart abandonment rate, which may be a signal of some major issues preventing your potential customer from completing their purchase.
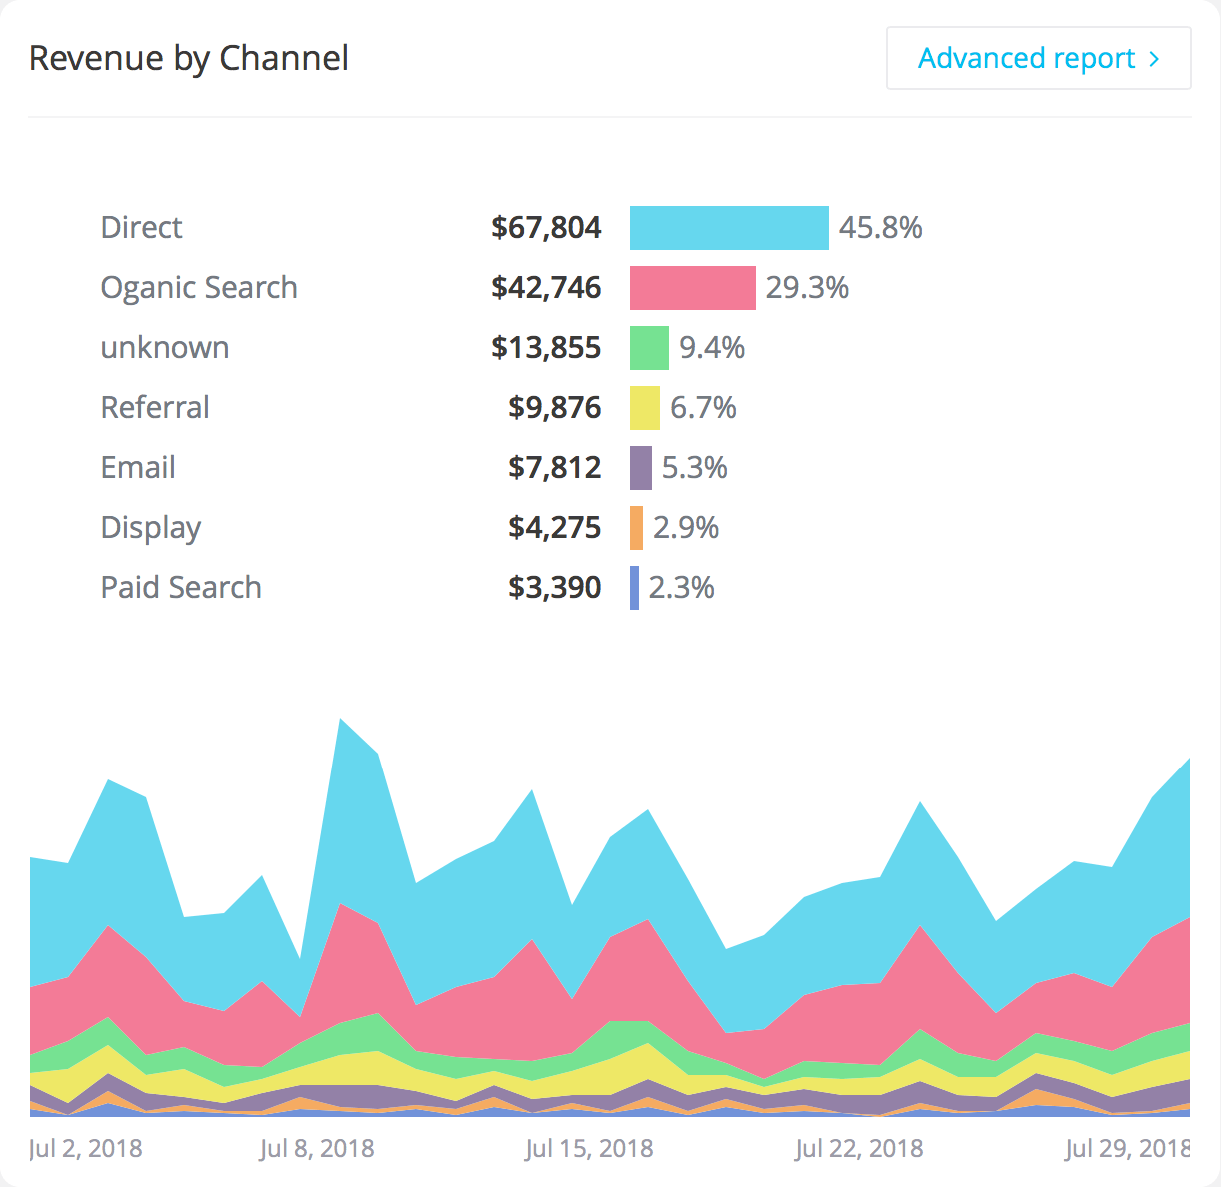
Revenue by channel
See which marketing channels are bringing most of your revenue, and which ones are underperforming. The chart shows you how revenue from each channel changes over time, which helps you spot any unusual fluctuations that might signal an opportunity or a problem.
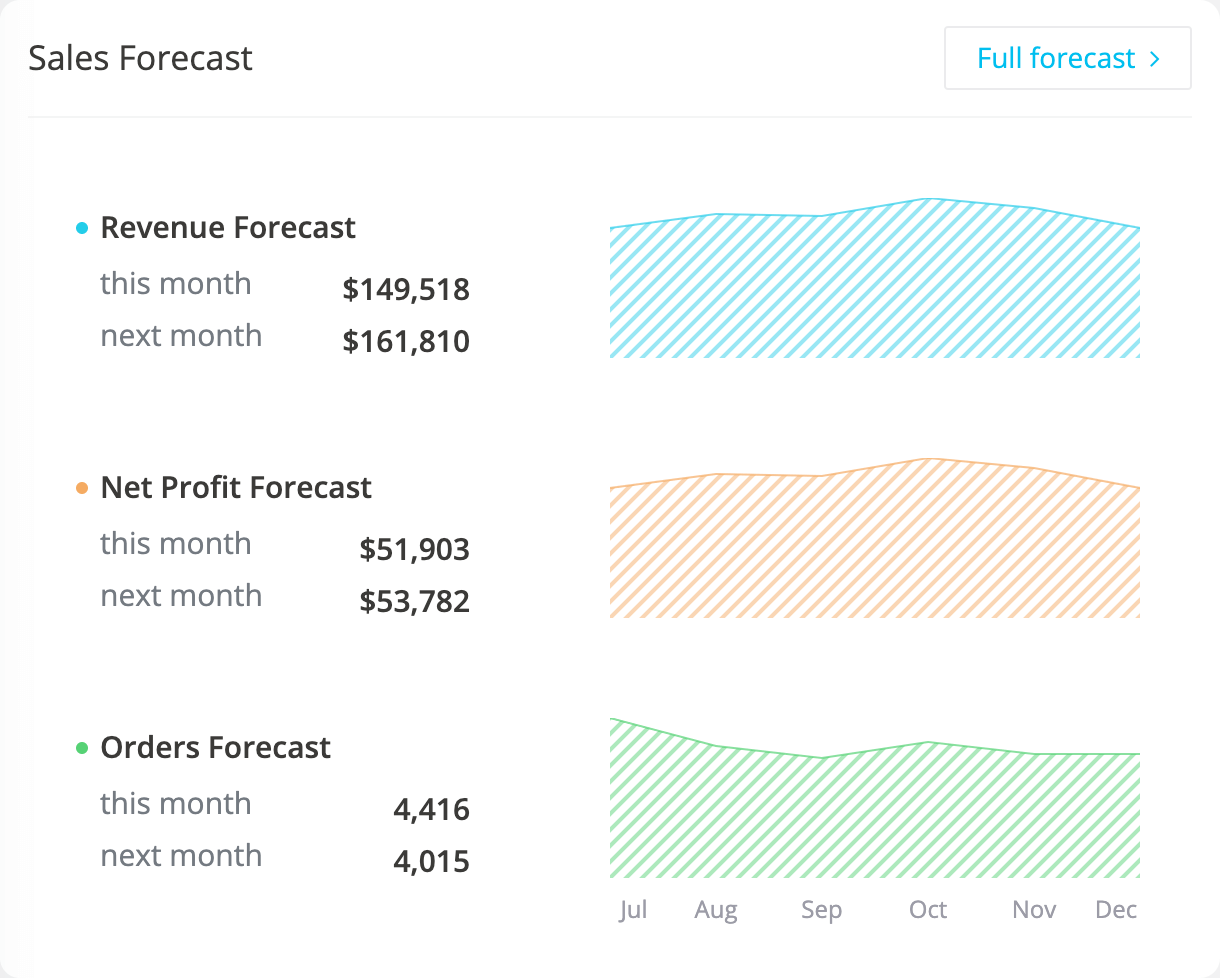
Sales forecast
Get a quick look at the projections for you key metrics such as Revenue and Net Profit. See the forecasted trend on the chart, and go into the full report for more detail. We think this is one of the coolest widgets on your ecommerce dashboard.
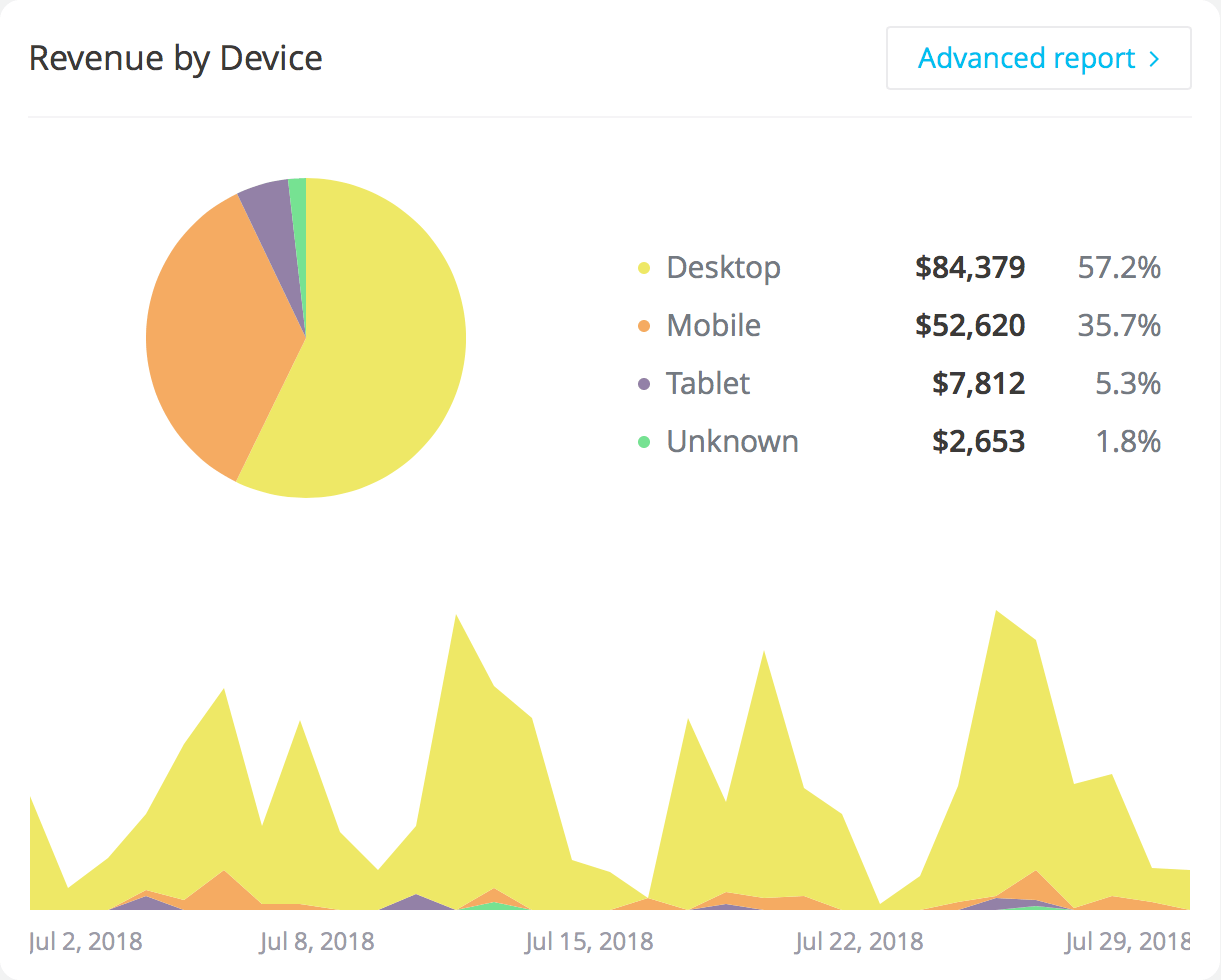
Revenue by device
Find out what devices your customers use to buy from you. This might give you a better understanding of how your customers use your site, and whether you’re catering to them appropriately.
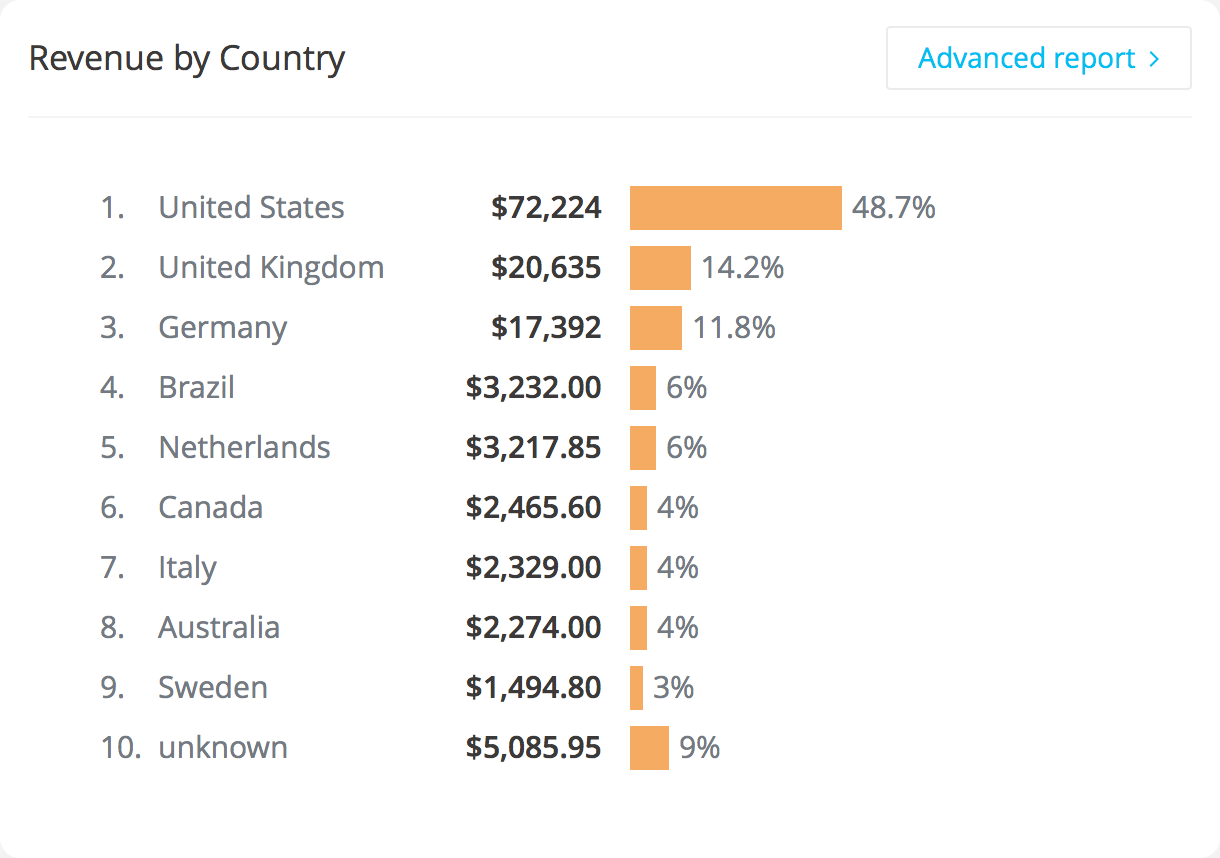
Revenue by country
Track which countries your customers are coming from to be able to sense any new potential markets and adjust your strategy accordingly.